
Financial Reports turn booking activity into money. They’re where you go for income totals, per-event earnings, and breakdowns that show where your revenue actually comes from.
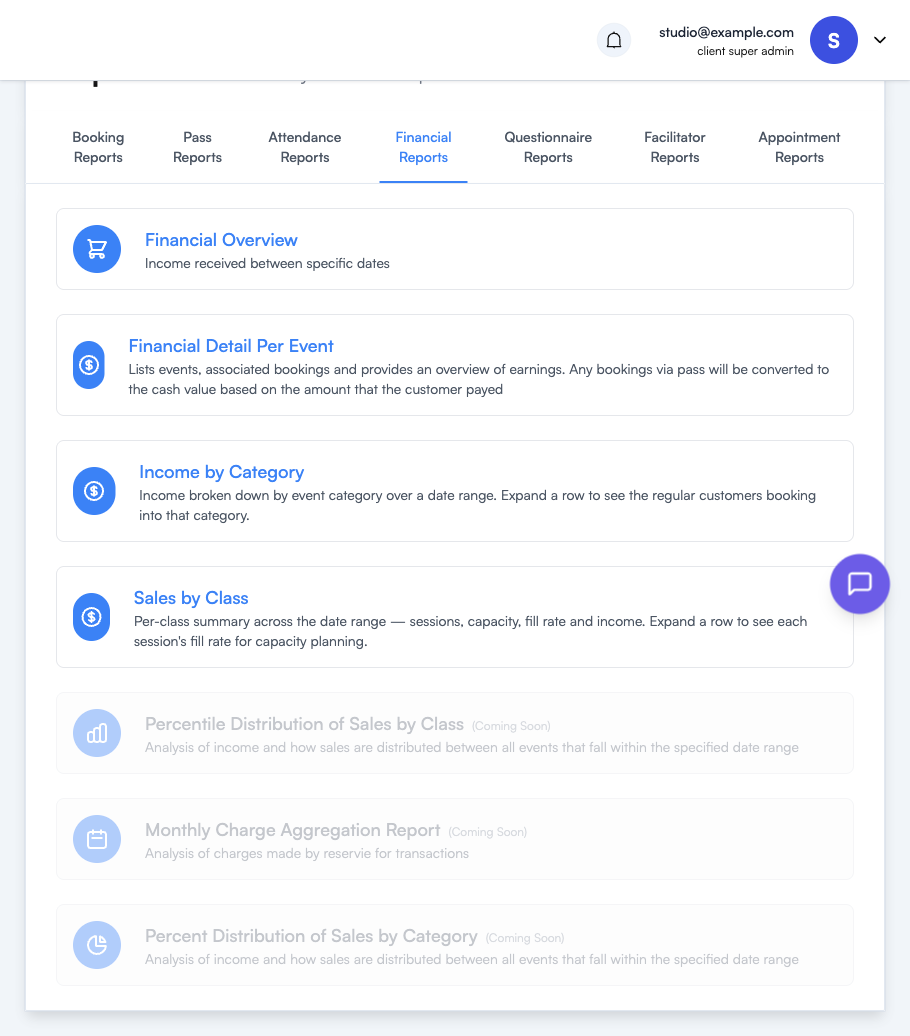
| Report | Use it to answer |
|---|---|
| Financial Overview | ”What did we take between these dates?” — Income received across a date range, at a glance. |
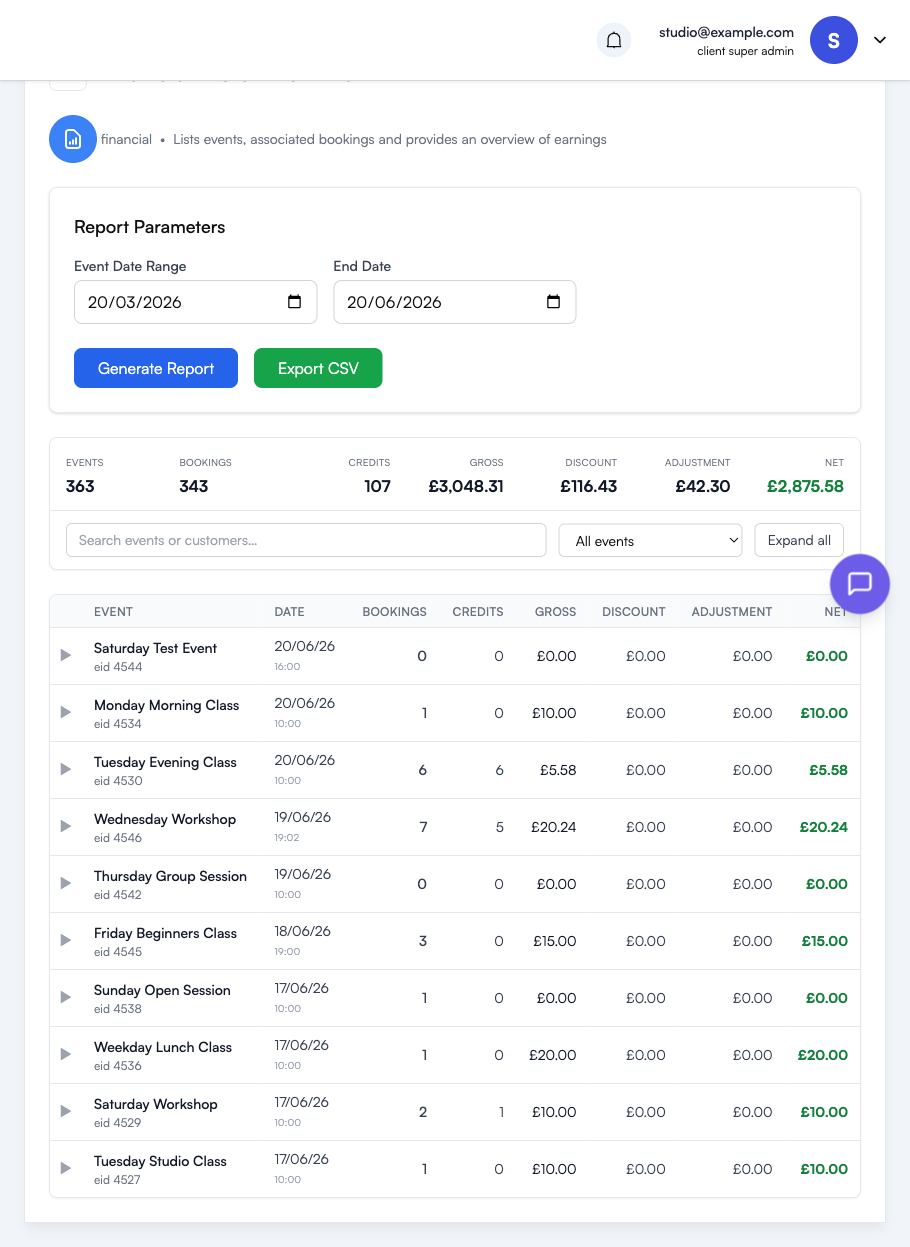
| Financial Detail Per Event | ”How much did each event make us?” — Lists events and their associated bookings with gross, discount, adjustment and net. Bookings made via a pass are converted to the cash value the customer originally paid. |
| Income by Category | ”Which kinds of session earn the most?” — Income broken down by event category over a date range. Expand a row to see the regular customers booking into that category. |
| Sales by Class | ”Where’s my capacity going?” — A per-class summary across the date range: sessions, capacity, fill rate and income. Expand a row to see each session’s fill rate for capacity planning. |
| Class Attendance Overlap | ”How many of the same customers book into two or more of my classes?” — Pick the classes you want to compare and a date range; the report splits your customers into who books one, the other, or both. |
When you run a report, a summary bar totals the key figures and the table breaks them down event by event. Use the search box to find a specific event or customer, and Export CSV to take the full dataset elsewhere.
Class Attendance Overlap
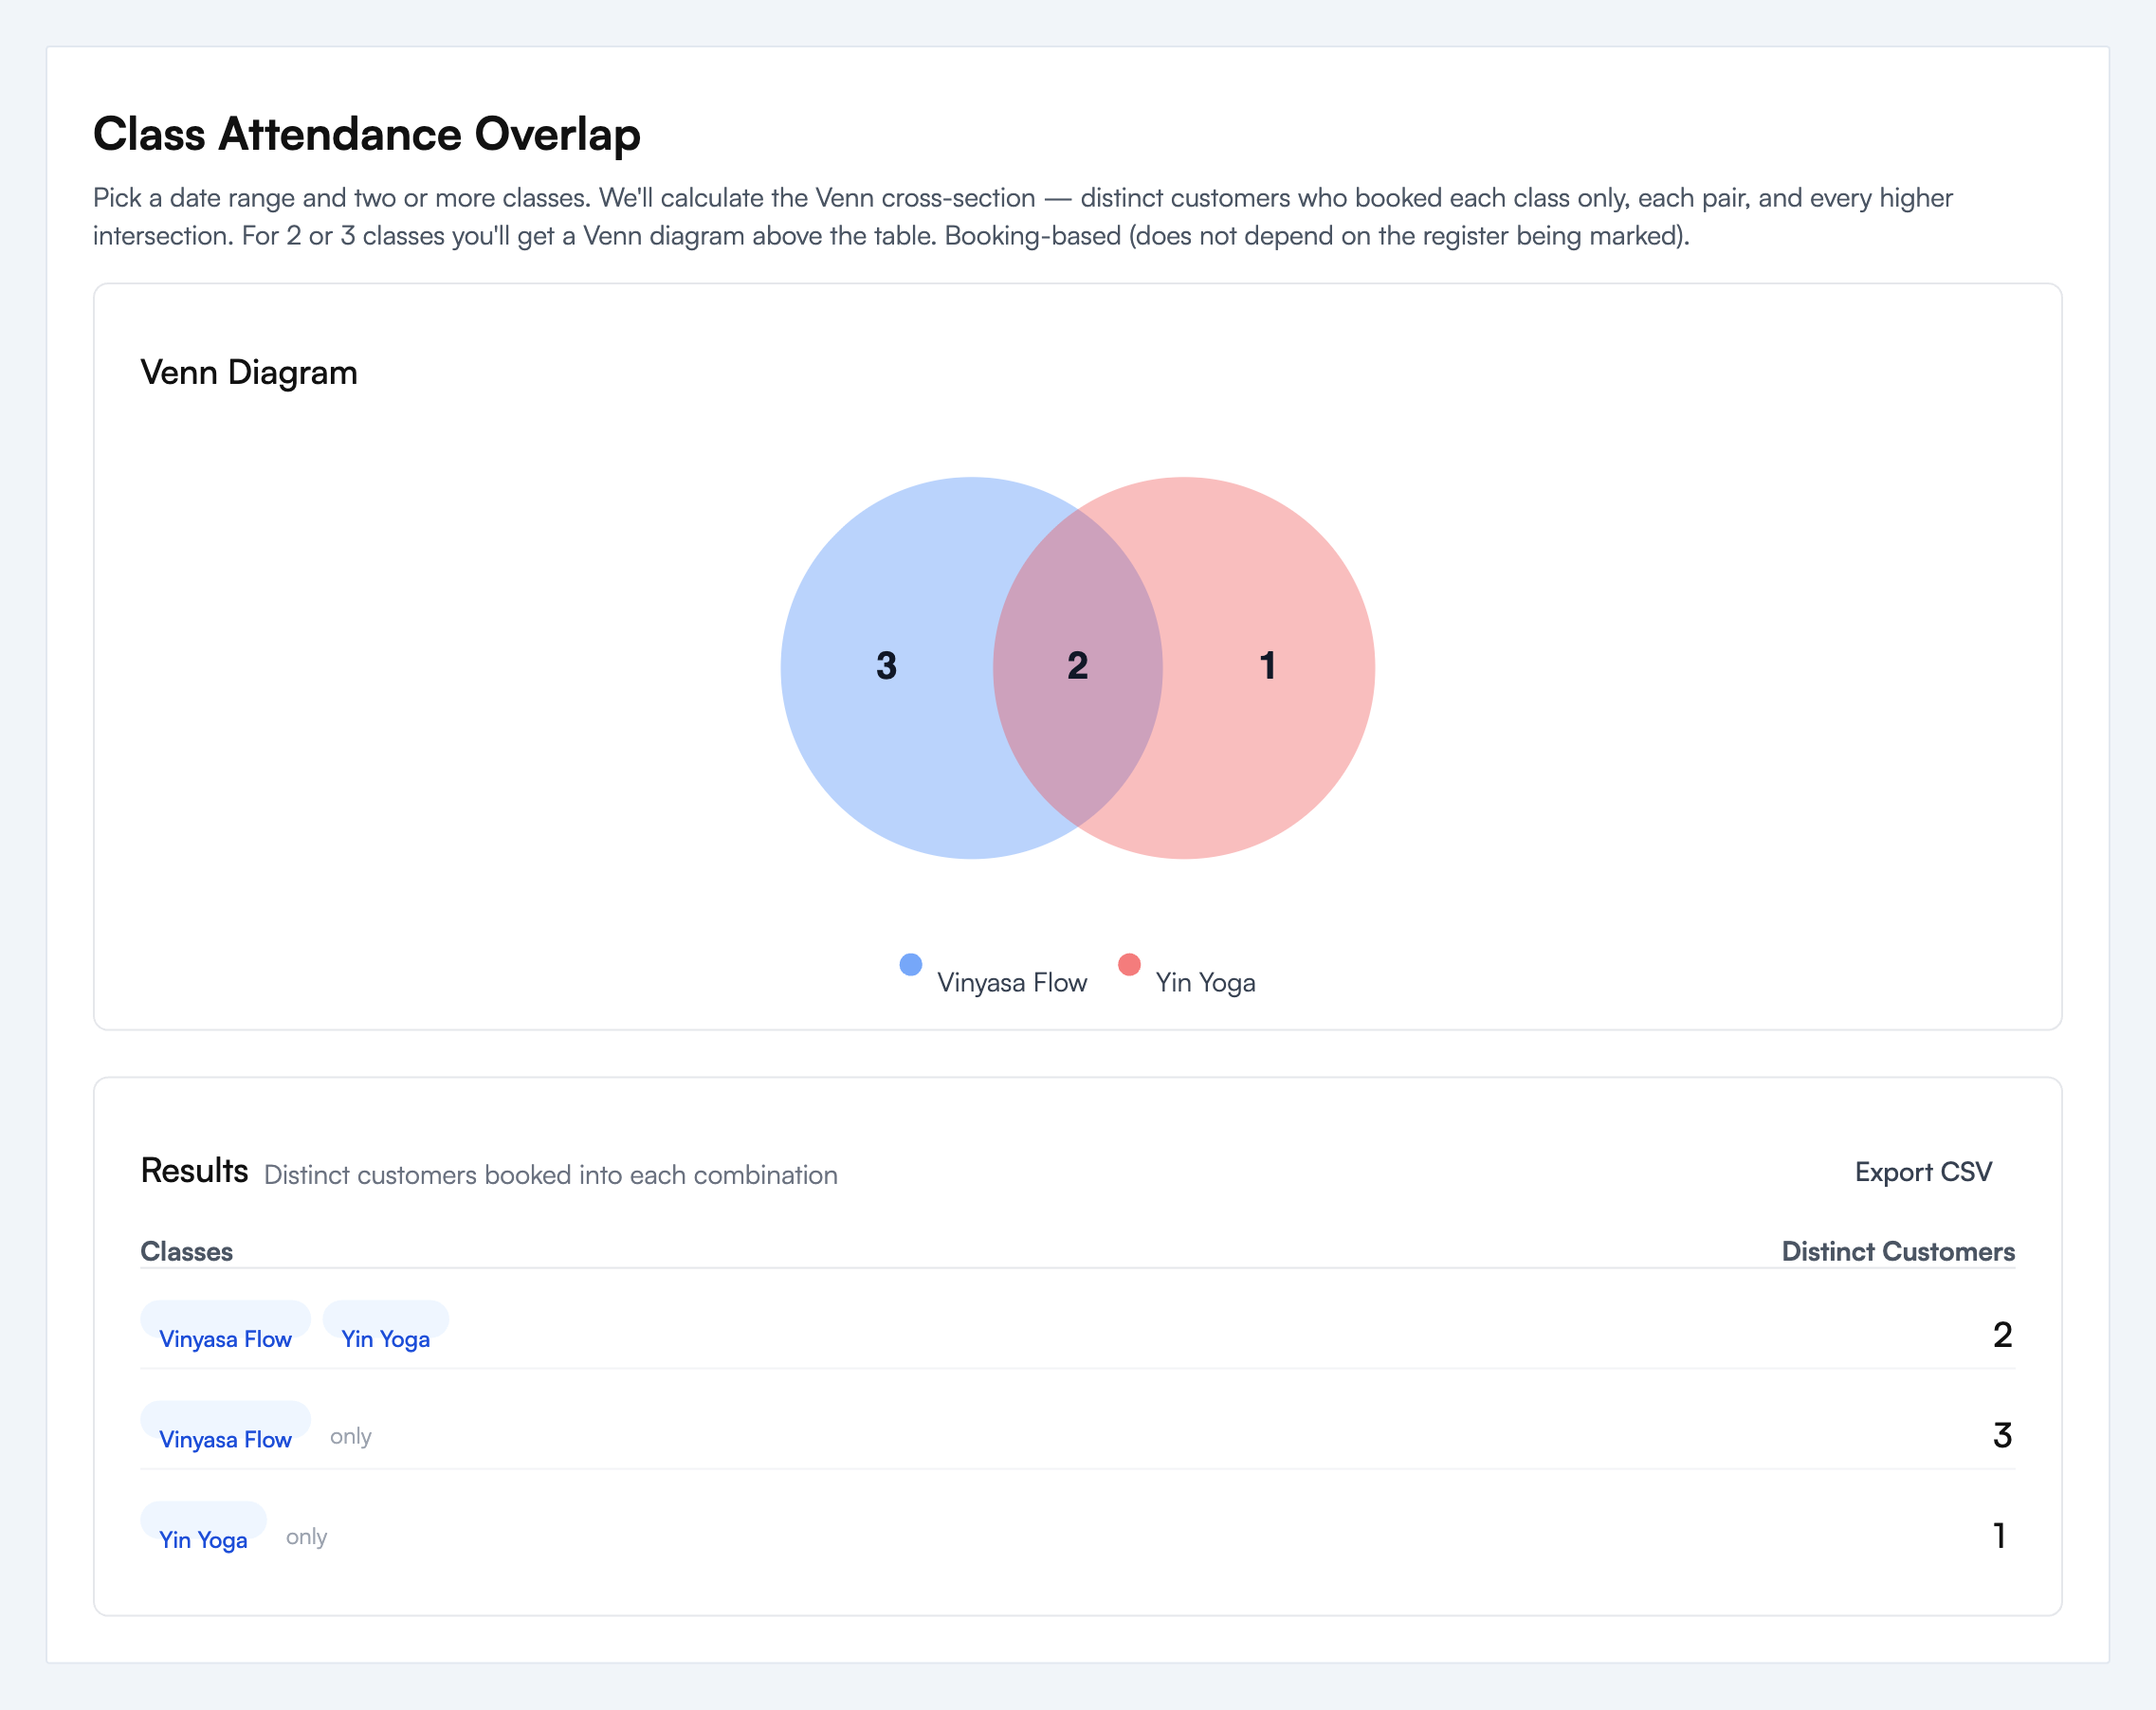
Class Attendance Overlap answers a single question: across a date range, how many of the same customers book into two or more of your classes? Pick the classes you want to compare and the report splits your customer base into mutually exclusive groups — booked one, the other, or both — and draws a Venn diagram when you compare two or three classes.
It’s a quick way to see how much your audiences cross over: whether your Hyrox crowd also comes to your GT class, whether Saturday-workshop bookers are regulars or one-offs, or which retreat bookers haven’t been to a class lately (a ready-made marketing list). The overlap is almost always smaller than you’d expect — it’s a useful reality check.
How to run it
- Pick a date range. It defaults to the last three months ending yesterday, and can span up to five years.
- Click Load classes. The picker fills with every active class that runs at least once in that range. If you’ve recreated the same-named class several times over the years, they’re grouped under one name with a “×N events” note — selecting it includes them all.
- Tick at least two classes. Use the search box to narrow a long list. Run Report stays disabled until two are selected.
- Click Run Report.
- Read the results. With two or three classes you get a Venn diagram above the table; with four or more, just the table (there’s no clean Venn for that many). Each row is a distinct-customer count for one combination, largest overlaps first. A row labelled with a single class name and only means customers who booked that class but none of the others you selected.
- Export CSV to take the numbers into a spreadsheet.
Good to know
- The counts are booking-based, not attendance-based. A customer is counted as soon as they’ve paid for a place, whether or not the register was marked. For register-marked attendance use Attendance Reports instead.
- Each customer is counted once per class. Someone who booked the same class six times counts as one here — which is why these totals won’t match booking-counting reports like Sales by Class. Both are correct; they’re answering different questions.
- No classes in the picker? There are no scheduled sessions in the date range — widen it.
- All counts zero? The selected classes have no bookings in that range. Check the bookings exist via Booking Reports for the same dates.
Coming soon
Three further reports are on the way and appear greyed out until they’re live:
- Percentile Distribution of Sales by Class — how sales are distributed across all events in a date range (long-tail vs. concentration).
- Monthly Charge Aggregation Report — a roll-up of charges by month for accounting.
- Percent Distribution of Sales by Category — revenue split across categories, for understanding your format mix.
For accounting: for tax filings and book-keeping, pair Financial Detail Per Event with the underlying Stripe payment record. Stripe is the source of truth for what hit your bank account; reservie’s report tells you which booking each charge corresponds to.
Tips
- Income by Category is the fastest way to see whether your revenue is concentrated in one format or spread across many — important before you drop or scale a class type.
- Sales by Class fill rates are your capacity-planning lever: consistently full classes justify adding sessions; consistently empty ones may need a schedule or price rethink.
Where to go next
- Accepting Payments Online — the Stripe-side view of your income
- Booking Reports — the customer activity behind the income
- Reports Overview — how to run and export any report